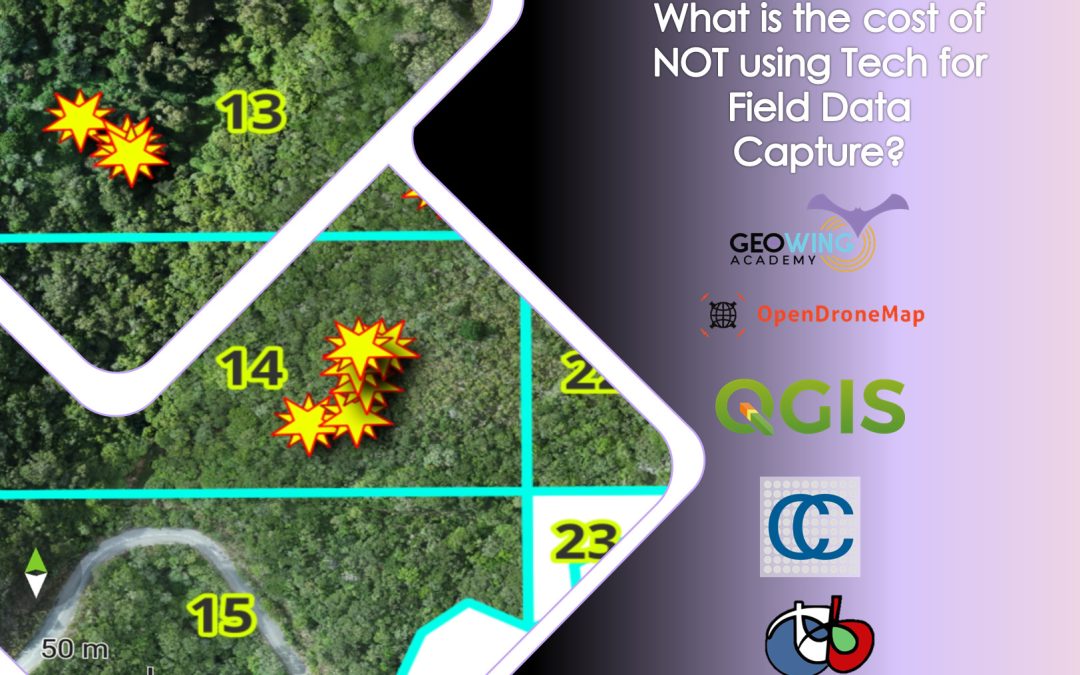
How drones, AI & Open Source Software can be used to combat Alien Invasive Plants in South Africa

How drones, AI & Open Source Software can be used to combat Alien Invasive Plants in South Africa

Alien Invasive Plants (AIP) have become a major threat to South Africa’s sensitive Fynbos biome. In 2017 and 2018, fires in the Western Cape region killed 8 people and destroyed over 2000 homes and devastated biodiversity in the region. The intensity of these fires was amplified by the massive amounts of AIP, in particular Black Wattle (Acacia mearnsii), Gum (Eucalyptus sp.) and Pine (Pinus sp.) that have gone unchecked and uncontrolled for decades. Now in 2025, the problem is even more pronounced and current methods of monitoring and clearing AIP are very inefficient, very time consuming and very costly. 

Drone technology and open source software can be used to map, locate, classify age, determine ease of access, determine urgency for clearing, define burn intensity and then plan removal projects based on this information. Drones can also be used to clear AIP by using precision spray methods to kill off very dense stands. This coupled with ground based removals will drastically improve current methods and we may actually have a small chance of regaining the biodiversity lost. 

This presentation was hosted by the Save Wild Project. For more information have a look at the presentation given to Western Cape municipality, government and communities on the subject of tech based applications for UAVs and AIP control here: 

Can RGB Drones & Machine Learning Be Used for Crop Health Analysis?

Can RGB Drones & Machine Learning Be Used for Crop Health Analysis?

ere Machine Learning and RGB drone data for plant health? GeoWing Academy decided to take a look at how effective using a custom built machine learning pipeline and RGB derived plant health indices for crop health analysis. The results are SUPER interesting!

A strawberry patch became the unwilling test subject for this experiment and two data sets where captured; one set on a cloudy day and one set on a sunny day. The machine algorithm was trained to find each strawberry within the patch and then compute each individual plants Modified Photochemical Reflectance Index (MPRI) value.

The MPR Index is an RGB-based vegetation index that compares green and red reflectance to estimate plant health. It produces higher values where plants reflect more green and absorb more red — a common sign of healthy, photosynthetically active vegetation. Higher MPRI values indicate more green reflectance relative to red, which often corresponds to healthier vegetation (since healthy plants reflect more green and absorb more red due to chlorophyll activity). Lower MPRI values suggest more red reflectance relative to green, which can indicate stressed or sparse vegetation, or non-vegetated surfaces.

The overcast scan MPRI statistic mean of 0.087 indicates that the plants in the  patch were moderately healthy which ties in well with the ground truth evaluation done by the farmer. The patch was then subject to cleaning (all dead and dying strawberry leaves removed) between the two scan dates, the next scan being conducted on a sunny day. The sunny day scan bore some very interesting result indeed!!

This index will not be as rigid as multispectral imagery and will only display surface (visual) health differences but it certainly has its place for crop management where time and money are a factor of production. So can it be a useful tool? Find out in GeoWing Academies latest vlog:

Dam It! How drones can be used to survey potential dam and reservoir sites

Dam It! How drones can be used to survey potential dam and reservoir sites

15 years ago I was managing a game reserve in the Mapungubwe area in North Limpopo South Africa. The reserve had not had a permanent manager and there was some serious need for maintenance on fences, roads and dams. In fact there was only one of the four dams on the entire 3500ha reserve that had water in it. The rest had been damaged but flooding and neglect. One of my first tasks was to re-establish these vital water points. In order to do this, I had to use what’s known as a “Dumpy” level, a piece of equipment that allows you to read terrain levels in order to make sure that whatever you are building comes out level and straight, in this case it would have been the dam walls. Now you must understand that I had never used this sort of fancy pants equipment, so the learning curve was steep and fast. I was used to using a piece of string and a spirit level, so this new tech was a bit challenging to get right initially and walking back and forth across broken earth dam debris in 35 degree C heat to take measurements was time consuming. Needless to say, more colourful phrases other than “dam it” were thrown around as I fell over a number of times traversing the treacherous terrain with the cumbersome equipment. I remember thinking back then that I hoped the future would have easier ways of doing this sort of work.

Image 1: One of the many broken dam walls on the property. This particular one, although not a true “earth” dam was destroyed during a flood. The erosion damage caused by the breach also had to be filled in and brush packing used to prevent any further erosion should it have rained again.

It would have been nice to be able to calculate the amount of material needed for the construction of the new dam wall for budgeting purposes but at the time I had no real survey knowledge to be able to work this out properly, so I gave a rough estimate and got on with it. I don’t like doing this because budgets are usually very tight when running game reserves. Over spend here, loose out there and with so much that needed to be done, there wasn’t much wriggle room at all.

Fast-forward to 2023 in another part of the country. I was asked by a member of the local farming community whether or not drones can be used for surveying potential dam sites that would be used to irrigate lucerne fields and orchards. The intended areas were shallow valleys that, should the earth dam walls be built, would flood providing hundreds of thousands of cubic metres of precious water to the surrounding farms. Well, that was the thinking anyway but the farmers could not be sure if these figures were true just by eyeballing it and wanted surveys done of each site to see which would yield the correct amount but they had a very limited time frame in which to do it. Having done dumpy level surveys on dams much smaller than the intended dams of this project, I knew that traditional survey methods would not work within their limited timeframe at all as they would take many days for each site. The terrain was rough and at least two trained surveyors would be needed to survey each site (surveyors for these sorts of projects come with a very high price tag as well).

Image 2: This drone image is from another site but shows what a dam would look like once completed and shows the dam wall length, (108.5m) the flood plain perimetre length (excluding dam wall, 547m) and the volume of the dam (92 972 cubic metres).

Challenge accepted! Admittedly, at this point I had not done a potential dam site survey with photogrammetry outputs but, as we know, when you are working with powerful GIS software and centimetre GSD (ground sampling distance) 3D data, you can do almost anything with regards to geospatial information acquisition. It took nearly five batteries for the DJI Phantom 4 Pro V2 (roughly 80 minutes of flying time) to collect the required data per site, averaging 1000 images per site, covering 59ha and 70 ha respectively. This turned out to be overkill but it is always better to collect more data than to find out you are short and have to redo the flights. It took about 3 hours of processing time per site to render the Digital Terrain Models (DTM) and high resolution orthomaps needed for the GIS site analysis. High precision georeferenced accuracy was not required for this project as the only numbers that were required where the flood plain areas, potential dam volume and potential dam wall length. (See https://geowingacademy.com/did-you-know-about-elevation-and-gps-offsets-between-drone-data-collected-on-different-dates-and-how-it-effects-photogrammetry-processing/ for more information on Relative vs Absolute drone map accuracy). Essentially, building a digital “virtual” dam was the name of the game for this project.

Image 3: Full scan area (70 ha) with p roposed dam outlined in yellow (926 064 cubic metres)

The GIS analysis part was a fairly straight forward process (well at this point, I had done cut/fill surveys for mines prior to this project so some of the GIS skills needed had already been learned prior to this project). The farmers had stipulated that they wanted a 50cm contour map as well as the volume, area and perimeter information. So 50 cm contours were computed using the DTM. Two orange road cones were placed where placed on the ground on either side of the valley on each site to show where the wall would be built between before the drone flight. These were then used to draw a digital “wall” and the contour line that intersected the potential dam wall was used to calculate the floodplain area and dam perimeter length. The potential dam volume was then calculated.

Table 1: The dam parameters calculated in GIS.

So everyone was happy and after 2 days the reports were sent off and the job was done. But I wasn’t satisfied. There must be a way to calculate the façade area of a potential earth dam wall as well which would allow for the calculation of materials needed for which can be factored into the budgeting process. So, with some assistance from an engineer, who asked me if it was possible to work out a number of different things in GIS in terms of horizontal and vertical measurements. I had not done this before but I knew it was possible (anything is possible with this amazing technology) so it was back to the drawing board and I set about how to work out a method for acquiring the various measurements that were needed. He then took these measurements and showed me how these can be used to calculate the façade area of the dam wall. This was brilliant! When you combine this information with the known measurement requirements for stable earth dam wall construction, you can calculate the estimated amount of material needed to complete the job quite accurately, so when it comes to compiling the budget report for the dam projects, Bobs your Auntie! You can learn how to quantify dam measurements with GeoWing Academy’s DAM IT! Course, a two part deep dive into all things dams!


What does it cost to introduce Machine-Learning into conservation, forestry & agriculture management?

What does it cost to introduce Machine-Learning into conservation, forestry & agriculture management?

When looking at orchards and plantations, the short answer to this question is “Much less than you think”! The long answer: “How to go about it?” Let’s dissect that a little shall we?

Data collection using an off-the-shelf consumer drone that is capable of functioning with either proprietary or third party mission planning apps is a fairly simple process:

  • demarcate the target area (with a good amount of buffer around the edges),
  • set the altitude (consider target size therefore ground sampling distance – GSD – requirements),
  • set the image overlap (80 front / 80 side for good canopy coverage),
  • set the flight speed (remembering that weather conditions determine shutter speed which determine flight speed)
  • and off you go!

Let’s say we want to count the number of trees in our newly planted orchard, inspect their canopy health, and acquire each plant’s GPS coordinates. The field is fairly homogenous, there are a few grasses, ferns, weeds and sedges between the newly planted trees, but for the most part the rows are clear (it’s important to consider when to fly and that the cleaner your target area, the cleaner your computations). The tree canopies are fairly well established, so a GSD of ~3cm per pixel will suffice (90-100m above ground level flight level when using a DJI Phantom 4 Pro V2).

Processing the data is a fairly straight forward process too; in WebODM simply using the default “High Resolution” settings will generate the RGB orthomaps, Digital Surface Model (DSM) and 3D point clouds required for later use in Cloud Compare and in QGIS along with the machine learning algorithms from the Orfeo Toolbox.

Goody! So we know what our project, data capture and processing requirements are and we have our maps and models ready.

Figure 1: Scan area, roughly 3ha. Mostly bare ground, good tree separation. Weeds, grass, sedges and ferns have started to encroach in some areas.

Now we need to download the Orfeo Toolbox libraries and get our hands dirty for a minute. These powerful machine learning algorithms allow us to customise our output requirements and make fine adjustments to the machine learning process which will help when it comes to isolating objects within our RGB drone data sets. These algorithms work best when the target area has well contrasting vegetation and definitive objects as it is easier for the algorithm to classify pixels. So for orchard and plantation detections, these algorithms are usually able to detect the target trees with a high level of confidence and accuracy. You just have to know how to tune them correctly.

Adding layers of depth for the algorithm to read off also improves the detections by giving the algorithms more information. This can be done by adding vegetation health index maps and tree canopy height models (CHMs) extracted from 3D point data. When working with plants and when you have access to multispectral drone data (Near infrared and red edge) you can add these layers or create index models using the multispectral information to create a good level of depth for the algorithm to feed on. In this example, only RGB data and RGB indices were used.

Figure 2: Overhead view of the canopy height model (CHM) generated using 3D point clouds (scale bar on the right in metres)

Figure 3: Side view of the CHM showing terrain gradient as well

Figure 4: Plant health index

Now we need to train the algorithms what to look for; this is effectively a “supervised classification” where you are telling the algorithm what-is-what in the image, then isolating the required object from the “noise”.

Figure 5: Training polygons that tell the algorithms what to look for in the image

Once the tuning has been tested and you are satisfied with the detection accuracy and results, you can then decide on the data you would like to output from the detections, such as plant health for each tree, canopy area, tree spacing, GPS location, average tree heights etc. The big advantage of open source software is that it is highly customisable and it is very easy to design a model that spits out the specific data you need.

The importance of layering and choosing and tuning the correct algorithm for the job when you compare detection data becomes clear.

Figure 7 (right): Basic detections, no layering using the default settings in orange

Figure 6 (left): Target area with mixed vegetation. The similarities in vegetation RGB colour of some plants may cause confusion for the algorithm (a fern might be misidentified as a target tree for example). This is why layering, tuning and using the correct algorithm with the right amount of training information is important.

Figure 8 (left): Basic detections, no layering some tuning in blue over orange (note the slight difference of the detection, excess incorrect pixels are now excluded).

Figure 9 (right): Finer tuning green over orange and blue.

Figure 10 (left): Finer tuning, additional training data and the introduction of an additional vegetation health index purple over orange blue and green.

Figure 11: Finer tuning, additional training data and the introduction of an additional vegetation health index using an alternative algorithm that was finely tuned (in red). Note how the algorithm is now eliminating all non-target tree pixels and only finding the correct object.

Once tuned, the pipeline is ready for repeatable use with very minimal input required. The drone maps go in, you tell it what to look for, hit run and the data tables come out the other side. Super easy! The tuning may take a bit of time initially, but once tuned you don’t have to tune again! So lets say you want to look for alien vegetation in indigenous forest during the flowering season, find and count sea cucumbers on a shallow reef or look for ground bird nests in open areas, the process becomes a lot faster and simpler than having to do so with traditional methods only (it is important to note that you must still ground truth the outputs and don’t rely soley on the technology! Drones and GIS are “force multipliers” and not “silver bullets”).

Figure 12 (above): Tree detections marked by points after the detection pipeline was tuned and automated. The process needs to be smooth with as minimal input and as repeatable as possible. So: data maps in – train model – data tables out.

Figure 13 (above): The confusion matrix shows how confident the algorithm was with detecting trees. It is not possible to get 100% with RGB data or even hyperspectral, so this needs to be factored into the statistical analysis. More complex maps with very complex scenery and close colour matching between species means confidence may go down.

Figure 14 (above): An example of the data tables outputs that are generated through the custom pipeline.

So what does all of this have to do with cost? Well let’s break it down. An off-the-shelf drone may cost a few hundred dollars and a mission planning app that automates the drone’s flight path for simple mapping missions is either free or has a small monthly fee of a few dollars. So that is the hardware side of things. Then there is the photogrammetry software; with WebODM, the installation driver is extremely affordable compared to proprietary software such as Pix4D or cloud-based platforms such as Drone Deploy, which can easily go into the thousands of dollars for the subscriptions (don’t get me wrong, these are phenomenal platforms but are not necessarily in the range of a farmer’s or a conservationist’s budget). It is also free if you have the tech skills to install the drivers yourself. Now on to the GIS software: well QGIS is totally free (donations to the project are a must if you are to use this software though, without these brilliant minds giving their time to building this software, we wouldn’t have these tools so please donate) and so is the Orfeo Toolbox with all the machine learning libraries. The cost of training is also inexpensive and within a few days you can go from zero understanding of drones and GIS to creating your own custom machine learning pipelines for your project specific needs (go to www.geowingacademy.com for more information).

So for under USD$1000 you can capture, store, analyse data, build and customise your own reusable machine learning process that can be used over and over again with minimal inputs for massive outputs as well as keep digital records for later comparative use.

Lastly we have to factor in time (after all time is money). How much time and therefore money do you save by using technology for data capture and analysis compared to using traditional survey methods? The answer to that is…priceless!

Did you know about elevation and GPS offsets between drone data collected on different dates and how it effects photogrammetry processing?

Did you know about elevation and GPS offsets between drone data collected on different dates and how it effects photogrammetry processing?

When it comes to capturing drone data correctly, it is important to understand what will happen during photogrammetry processing and how this will affect the results. It is also important to understand how the meta data used in the photogrammetry process changes from survey date to survey date and how this will affect the processing results of comparative data. Here’s why this happens and how to address it effectively:

Processing Drone Data from Different Dates:

Reconstructing 3D models or DEMs using images captured on different dates often results in misalignment or offsets. This happens because photogrammetry software relies on image metadata that is recorded to the image when the photograph is captured. The metadata includes the x, y, z position of the drone in 3D space. This is recorded by using the drones’ “brain” components which includes components such as the GPS unit, compass, Inertial Measurement Unit (IMU) barometer, ultra-sonic and vision sensors. Atmospheric data such as barometric readings (air pressure altitude) as well as satellite positioning (GPS) can vary significantly between survey dates. Even lighting differences can impact image stitching accuracy, but for the most part the lighting differences are corrected by a smoothing process during the image stitching process.

Figure 2: Side profile showing the lifting of points for the same reasons mentioned above (not enough/confusing image overlap and different atmospheric conditions between capture dates). The measurement tool in WebODM shows just how much error there is between “flyer” points.

Figure 1: 3D point cloud points lifted and side shifted from the model from due to insufficient image overlap. This may also occur when image data is captured on different days with varying atmospheric conditions such as sunshine, cloud cover and changing barometric pressures. The measurements of point misalignment are in metres.

Solution

1) Ensure high enough image overlap (min 60% front and side when using WebODM, see Foundation Course for more info) then stitch generated orthomaps in GIS afterwards. Ensure that there is enough map overlap for stitching. This may not work as well for DEM models as the elevation information may need to be matched or corrected before stitching.

2) Stitch images are sets that were taken on the same day rather than trying to stitch all together. This may work sometimes, but when enough time and atmospheric change has occurred between survey dates, there may be discrepancies in the data.

Contours highlight elevation differences when comparing data captured on different dates:

Viewing contours with labels in QGIS highlights elevation mismatches caused by metadata discrepancies. The elevation data on a DTM captured from one scan will differ compared to that of a scan done a few days later. When using an off the shelf consumer drone, the offset differences between maps and models regarding elevation and X and Y positioning can be in the 10s of metres. This is also true for RTK or PPK drones, but the offset will be much smaller (between 1 and 2cm). This is why it is important to use GCP, RTK or PPK methods where high precision geo-referencing is required.

Figure 3: Map of a mine pit showing the 5 metre contours from two different scans (one in 2022, yellow, and the other in 2023, purple). Note that the 2022 scan indicates the contours in the 100s of metres whereas the 2023 contours are in the 10s of metres. This is due to the barometric pressure differences between the scan dates. The alignment of unchanged terrain contours do not align correctly with each other either (2.6m offset), this is because of the change in GPS variations between the two dates. Note the areas where excavation in the mine pit has taken place (red square, baseline contours of pre excavation date in yellow).

Solutions when using a consumer drone

1) Use ground control points (GCPs – a target visible to the drone from the air) that have been measured using surveying equipment to get the precise elevation and GPS coordinates of the target centre. Incorporate the GCP values and drone images of the GCP into WebODM using the GCP option before processing.

2) Post process alignment. If you have a baseline data set or map that has been correctly aligned using GCPs or RTK data (if precision georeferencing is necessary) you can align the following comparative data sets from different dates to the baseline data in QGIS using the georeferencing tool. If georeferencing is not required, align your comparative data sets with your non-georeferenced baseline every time. Using fixed GCPs just as visual aids will help here too; even if they are not survey grade GCPs (the alignment process will be faster). This way ensures consistency. Further steps may be needed to ensure elevation matching to the baseline data set.

3) You can align your comparative 3D point clouds with the baseline data in Cloud Compare.

Even Google Earth Images Shift:

Did you know that Google Earth maps also show offsets between years? This highlights the challenge of achieving perfect geospatial alignment across datasets.

Figure 4: Note the pin positioned on the corner of the roof of a house on Google Earth.

Figure 5: Google image of the same house without adjusting the pin a year earlier. Offset to roof corner: 1.62m, bearing 204.48 degrees.

Figure 6: Offset and image detail of the same house in 2012. Offset: 4.47, bearing 197.74 degrees. The pin has remained in the same place. This also illustrates how drones can be used to get up to date information in rural areas where satellite data may be very out of date and look like this.

Importance for Ground Survey Data:

When combining ground survey data from a surveyor with non-RTK drone data, alignment can be corrected using tools like the GCP pre-processing tools in WebODM, post processing methods in CloudCompare or georeferencing in QGIS are also options but take more time and knowledge to aligne map data sufficiently to a baseline data set. Aligning drone data to ground survey data ensures better geospatial consistency. If georeferencing is not required, always align datasets to the baseline data set.

Relative vs. Absolute Accuracy:

Drone maps provide high relative accuracy, which makes volume, line, and area measurements within the drone map itself in GIS reliable and real-world accurate. However, for engineering-grade georeferenced precision (absolute), the use of surveyed GCPs or RTK (Real-Time Kinetic) drones is essential. RTK provides high GPS accuracy by referencing a base station, yet even RTK-captured maps can shift geographically over time—much like Google Earth imagery.

If georeferencing accuracy is critical (e.g., for engineering projects), consider RTK drones or integrating ground control points (GCPs). For most other applications, drone maps are sufficiently accurate for measurements within the dataset itself.

Can drones be the answer to urbanisation and conservation conflicts?

Can drones be the answer to urbanisation and conservation conflicts?

I live in a small town on the coast in a part of the world where beauty knows no bounds. As I write this the sound of birdsong outside my window echoes through the valley below and the chirps of frogs rise up from the tributary that winds its way beneath the forest canopy. The rain has lifted, after a much needed overnight downpour, the clouds now sitting higher in the sky as if to reset for the next predicted deluge. We needed it; it has been so dry of late. It’s astonishing how quickly Mother Nature can bounce back with just a little rain. The distant ocean waves add to the organic orchestra playing all around me. The smell of fresh rain and decaying detritus fills the air with a gentle, calming touch. Little isolated transpiration clouds appear out of almost nowhere above some larger trees in the forest below and float upwards. I am watching Mother Nature breathe as she sings her songs of spring.

2020 (the year we dare not speak about) for me was heaven, as it was for the wildlife in my area. The human population was hidden away for months and this allowed creatures great and small to truly rule the roost once more, to roam free without threat or persecution from Homo sapiens. It was beautiful to behold. Bushbuck frequented the open community park, a grassy paradise to which they rarely had access to because of the human traffic through there. Porcupines and caracal were spotted more frequently on camera traps in the urban belt and when I went for the weekly shop (the only time we were allowed out); I would go past the estuary to see what freedom from humanity would look like in one of the most sensitive ecosystems we have. It was stunning to say the least. Birds for DAYS, no plastic, the grass long and unkempt, no prawn hunters but only large schools of fish the likes of which I had not seen before. And the air was still, so still. No noise from the once busy highway that traverses the river mouth to drown out the natural sound or shit on the atmosphere day and night. Just peace and quiet. At the time I wished we could stay like that, just to give nature a chance for once.

Figure 1: The stunning tranquillity of the estuary on a sunny afternoon

But back to the present. The world has certainly changed since 2020. With everyone moving office jobs online we have seen a mass exodus of people from cities to rural spaces. Not just here, but globally. To be honest it is horrendous. In my area the local town is seeing a huge population increase every year since covid restrictions started to lift in 2022. This is not only putting tremendous strain on our local water and power supplies, but has also increased the amount of traffic by about a billion million cars while rapid infrastructure development is pushing out the wild green spaces and wildlife. Roads are being widened to accommodate more and more traffic and more and more houses, housing complexes, estates and shopping malls are being built in rapid succession to cope with the burgeoning influx.

It is well known that if you are in the business of destroying our wild spaces, you will be financially heavily rewarded, but if you try to conserve the very life support that we cannot survive without, you might as well resign yourself to a life of living in a shoe box, eating sand and struggling to find any sort of funding to keep your local conservation efforts afloat. I think I speak on behalf of all those around the world who work in conservation; it seems to be the same everywhere. The conservationists want to protect an estuary, but developers want to build yet another holiday resort (that will remain at 20% capacity or less year round), as if there aren’t already enough.

Now of course (rant over) it is impossible to stop the migration and obviously these developments are inevitable. My gripe is that the very good conservation protocols and legal requirements are collateral damage when it comes to all these new developments. Wealthy newcomers don’t tread lightly on the environment and the local government and municipalities that are tasked with

Figure 2: Excessive bush clearing by contractors. The area in yellow shows the full extent of the vegetation cleared for the building. The area in red represents excess clearing which was not part of the landowner’s property. Area in metres squared

Figure 3: Correctly cleared stand with minimal damage to the surrounding vegetation with enough base vegetation to prevent erosion.

ensuring that the environmental and construction laws / guidelines simply grant relaxations left right and centre to those with the deepest pockets. Go ahead and cut down all the natural vegetation after the Environmental Impact Assessments (EIAs) are done, it’s just a box ticking exercise anyway, right? Now fill the property with concrete, build your house five storeys tall (even though the regulations stipulate a maximum of two that must not break the skyline) and put up lumens and lumens of spot lights for “security” that pollute the night sky and disrupt nature’s cycles. It’s easier to target the little guy though, so be prepared to feel the full wrath of the law if you want to put up a wee kennel for Fido next to the back door of your tiny house as this will cause erosion and contribute to global warming and possibly the extinction of humanity entirely.

Figure 4: Building height scale in 3D illustrating roof heights way beyond regulations (0 metres in dark blue – ground level to 12 metres in red – top of roof) 

Figure 5: Alternative angle showing roof heights way beyond regulations. Scale bar in metres.

I get that our local municipality is short-staffed when it comes to their environmental department and one person trying to get to all the sites in the area to ensure compliance is impossible. But why do we have so much money for the development department, yet so little to make sure that development is done correctly within the bounds of the laws that are there to protect the wildlife that we have and cherish so much as a community?

So what does my rant have to with drones, you say. I would say that drones can play a critical role in this process. By being able to frequently scan developing areas in sensitive eco-systems and get a baseline data model, municipal workers can monitor environmental changes more easily, faster and more accurately than ever before and enforce compliance to prevent damage timeously so that we might have a shot at keeping our wild spaces wilder for longer with less impact. Perhaps it can even be a community based project where those with drones can offer their services to simply fly sites and generate 3D models when they have a minute to spare? Could it actually become a reality where the municipalities actually work with the communities they supposedly look after and incorporate public participation in the process of development? I sincerely hope so. I want to sit here in the future and still be able to hear the birds, smell the rain, listen to the frog song and feel attached to Mother Nature.

To learn how to use UAVs for site management and clearing monitoring, click the button below:

error: Content is protected !!