
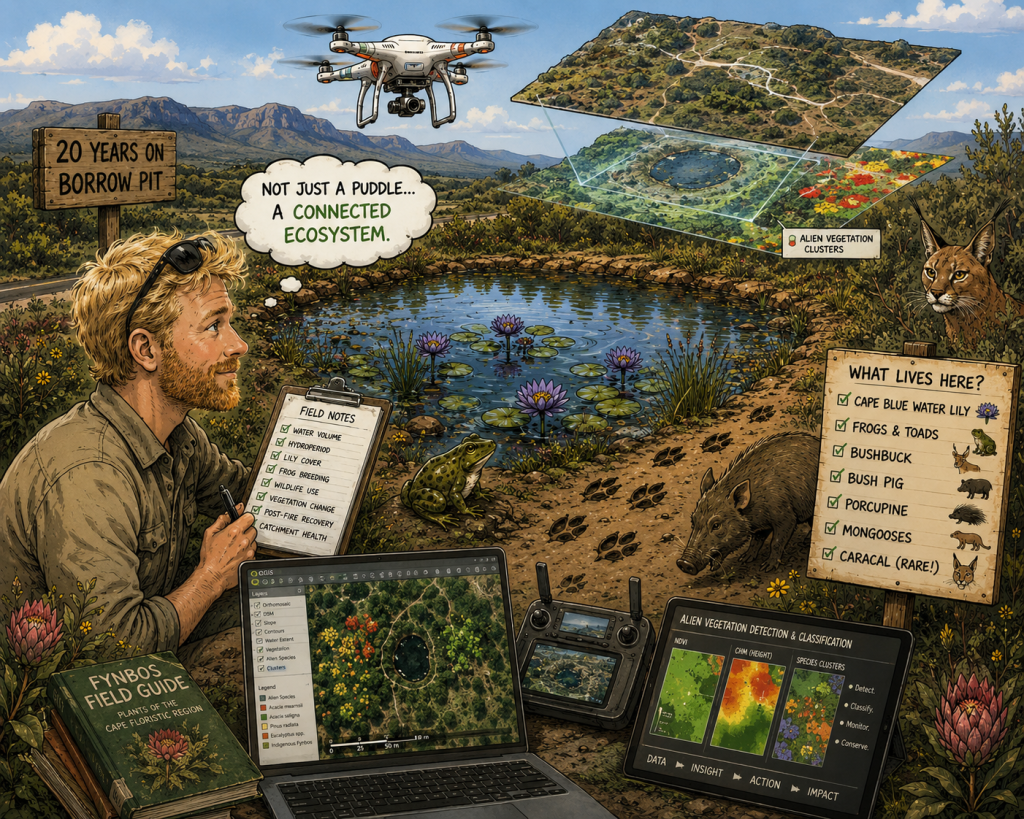

A few weeks ago I found myself doing something that probably sounds a little odd. I was calculating the volume of water in an old borrow pit. Not exactly headline-grabbing stuff, I mean who cares, we do that on mines all the time and why monitor a road side borrow pit anyway right?
The borrow pit sits out of sight in the bush, alongside a road in a patch of Western Cape fynbos. More than 20 years ago material was dug out of that spot to build the road. Today, after a good rainfall event, it fills with water as it has surely done since it was carved into the bush.
On a recent drone survey I decided to see if I could estimate how much water it was holding by comparing the drought data to the post flood data. Using drone photogrammetry, CloudCompare and GIS, I clipped out the basin, fitted the water surface and calculated the volume. The answer was about 228 cubic metres of water at the time of the post flood scan.
An interesting metric sure, the value to conservation on its own, not much. But then I started thinking. What does 228 cubic metres actually tell us? The pan was surveyed shortly after a rainfall event of roughly 216 mm in 24 hours. The pan went from empty to full. The water surface area at the time of the survey was about 214 m².
If we assume every drop of rain that fell directly onto the water surface stayed in the pan, the maths is fairly straightforward:
214 m² × 0.216 m = 46.2 m³
Yet the estimated volume of water in the pan was around 228 m³. In other words, direct rainfall could only account for about 46 m³ (20%) of the water present. The remaining 182 m³ (80%) must have arrived as runoff from the surrounding landscape.
That immediately changes how you think about the system. The pan isn’t simply collecting rain that falls into it, it is connected to the surrounding catchment directly. The condition of the surrounding fynbos, the soils, the slopes and even the nearby road all potentially influence how much water eventually ends up in the wetland. The funny thing is, this borrow pit is on a ridge line, not in a valley. So this immediately opens the door for more questions.
That switches the conversation from “How much water is in the pan?” to; “Holy shit, where did that water come from, and what controls how much arrives here after a storm?”
Then I thought about what I’d seen around the pan over the years; Cape blue water lilies (Nymphaea nouchali var. caerulea) growing in the water, frogs and toads calling from the banks and bushes around the pit, bushbuck tracks, bush pig tracks, porcupine tracks, grey mongoose, water mongoose and even the occasional caracal track. So clearly this artificial pan has become an important part of the ecosystem.
For years we’ve used drones to create maps orthophotos, elevation models 3D models all useful. But lately I’ve been finding myself less interested in the maps and more interested in what the maps allow us to measure.
Take the frogs for example; if somebody asked whether frogs had a good breeding season, most of us would probably look at rainfall records which makes sense right? More rain, more water, more frogs.
Except that’s not necessarily what the frogs experience. The froggos don’t care how much rain fell; they care more about how long the water sticks around for in their area after the rain so their offspring will make it to froghood. A wetland that holds water for six months tells a very different story from one that dries out after six weeks.
That’s something a drone data and GIS can help us measure over time. Survey the pan after the rain, survey it again a month later then two months later and so forth. Now we’re tracking how quickly the system loses water, how long aquatic habitat remains available. From that information we will then be able to say…”With this amount of rain, in these conditions, the borrow pit should accumulate X amount of water and retain it for X number of weeks therefore froggo X should have a glorious breeding season relative to water availability in the borrow pit”. That’s a completely different type of information.
The same applies to the water lilies. The lilies growing in this borrow pit are telling us something. They suggest the wetland is stable enough for them to survive year after year. They suggest the basin is retaining water for long enough to support wetland plants. If drone surveys show lily cover expanding or shrinking through time, which starts telling us something about the health of the wetland itself. That means every water lily in the pan is quietly recording information about the wetland itself.
Then there are the animals. The drone isn’t going to tell us how many bushbuck visited the pan. We can integrate camera traps to help estimate populations and record visits regarding this information. But it can tell us whether the wetland remained available during a dry summer.
Suddenly that little borrow pit starts becoming a lot more interesting. What happens after a fire? Does the wetland fill faster after fire? Does it retain water longer? Do surrounding plants recover differently near the water (obviously but what is actually happening, how much faster that surrounding areas and what affect does it have on the wildlife etc)? Do certain species persist longer around the wetland margins? Those are all questions that can be explored with repeated surveys.
The funny thing is that none of this started with a grand plan. It started with a volume calculation which on paper is just a nice number. Whoopdy twang, it means nothing on its own. In reality it may be the starting point for understanding how a tiny wetland functions within a much larger ecosystem. And that’s what I find exciting about drones and GIS. Not because they create pretty maps. Because they allow us to measure things that were previously difficult to measure, and ask questions that we may never have thought to ask. Sometimes all it takes is an old borrow pit, some frogs and a bit of curiosity.